Monday, January 28, 2013

Stock Focus: Apple


Apple's stock price tumbled by more than 10% in after-hour trading on Wednesday, post earnings release. Does it make sense? I don't think so. Let me walk you through the figures and I'll tell you why I think the stock is worth considering at this point.


Record Quarter


Fiscal Q1, from October to December, is the most important for Apple as it encompasses the holiday season during which retail sales are the strongest. They managed to generate $54.5 billion in revenues and $13.1 billion in profits in the period, a new record for the Cupertino based tech company. With that quarter's profits alone, Apple would be #12 in Fortune 500's ranking (which is based on annual figures). They also earned more in 3 months than what Intel, P&G or Citi achieved in the whole of 2012 (check for yourself). 


Strong sales and revenues progressions Year on Year


Below are three tables showing key products/segments evolution between Q1'12 vs. Q1'13. I took the info from Apple's website (here) and made an important adjustment by re-scaling the figures to weekly averages. This is crucial as Q1 2012 spanned over 14 weeks vs. 13 for 2013 and one would miss the company's real achievement by using gross quarterly data. We will use the "YoY (scaled)" column to assess the business evolution.


Table 1


Table 2
Table 3

Here are some of my observations mixed with takeaways from the analyst conference call (replay here) to put the figures in perspective:


  • iPod is losing:  well advanced in its life cycle, the dominant mp3 player is also suffering from cannibalization from the iPhone.
  • Mac got hit: this was due to supply constraints during the whole quarter; this should not be an issue anymore in Q2. Broadly speaking, PC demand is weak and Mac is also being cannibalized by the iPad.
  • iPad is a winner: Solid quarter with 22.9m units sold, a 60% increase compared to last year. iPad mini did well in reaching its audience but it also exerted pressure on the average selling price for the segment which fell from $535 to $466. Expect this to continue going forward (Tim Cook's words).
  • iPhone remains the king: still high and totaling 56% of the revenues with 47.8m units sold. The iPhone 5 introduction was a success and the fastest roll-out ever. All iPhones (4, 4s and 5 series) were in supply constraints during the quarter but sales remained very strong. Average selling price is slightly rising YoY, from $636 to $641.5, this is another sign that the iPhone 5 is doing well.
  • China stands out: the country is a big contributor to growth. Even if it still represent a third of the US in sales, it is growing at an amazing 80% rate. Apple is serious about it: Tim Cook paid a visit some weeks ago and was in talk with China Mobile, 4 new stores were opened, premium re-sellers doubled to 400, iPhones point of sales increased to 17,000 from 7,000. There is however no clear plan for an "iPhone mini" that many see as essential to compete with popular and cheaper competitor devices running on Android. 
  • Margins erosion: Gross margins fell to 38.6% from 44.7% a year ago. This is in part due to supply chain issues that will improve going forward but the erosion could persist for a while because of the current product mix. The iPad mini's margins are "significantly below" the company's average and selling more of it at the expense of the iPad means less dollars in per product out. The guidance for Q2 is for a Gross Margin between 37.5% and 38.5%, edging lower.


Good entry point


The figures above do not scare me. I see a company that is cashing in huge amounts of money and those amounts will remain huge even if growth and margins decrease gradually.

Let's be mentally flexible and imagine that Apple doesn't grow revenues this year. If this zero growth scenario would hold, we could take the $44.15 EPS from last year as an excellent proxy for 2013. If Apple is a falling star and if this zero growth period would then morph into an extended period of sluggish results going forward, we would maybe not pay more than 8x earnings to acquire it, so the price would be $353. Adjust this for the cash pile of $137bn, an add-on of $145 per share, and you get a fair price around $498. This is a quick and dirty valuation process but when you look at Friday's close at $439, this kind of make you think.

Even in a zero/sluggish growth scenario the stock looks cheap. I do believe that the track record of Apple means something for the future, innovation is still a key element that could make a difference. Tim Cook said during the call that the pipeline is "shock full" and that they "feel great" about what they have in store. I don't know what it is, I don't want to speculate, but at the current price the stock comes with a free call option on good surprises.

People get emotional when talking about Apple and they are fast to react on rumors. Selling in panic below $450 is like buying euphorically at $700 or above, it's a dangerous game. I see more upside than downside on the stock currently.

Disclaimer: I do not own Apple shares and do not intend to go long in the next 72 hours. It is just my job to keep abreast of the company's news flow.


Monday, January 21, 2013

Options and stock price action

Last week's post, the first, was quite general with a few topics touched upon. Today, I would like to be more specific and try to be original while talking about Apple. A daunting task.


From the gossip to our topic


There is currently much gossip around the iPhone producer and the articles, blogs, research papers, TV shows, etc. that focus on it are simply incalculable. The noise was brought to a particularly high level this past week because of an article in Monday's Wall Street Journal that caught the attention of many. The paper reported (here) that the tech giant could have been cutting its orders to suppliers, which could indicate lower demand for its end product. Be it the cause or not, the stock was hammered in the pre-opening Monday, causing it to start the week around 502, a stark difference to the previous Friday's close at 520. This -3.46% move was especially remarkable in an otherwise flattish market opening. 

I had read lately about the fact that Friday the 18th of January was an important milestone for Apple's share ahead of the quarterly results on the 23rd. Some bulls and pundits on the stock were pointing at option traders when looking for what could be preventing price action on the upside: "everything would be cleared on the 18th", "go long at the end of the trading day on Friday" were among the things one could read. It then  appeared to me that options could have a bigger influence on stock prices that I thought, and this is what I wanted to investigate with today’s topic.


Apple’s price action this week


After the sharp down move on Monday morning, the stock neither continued its slide, nor embarked in the positive territory as did the broader market (S&P 500 at +0.7% for the week). It rather hovered around the USD 500 mark.The price did make a move on the downside to USD 483 on Tuesday and a swing north around the USD 510 on Thursday, but it finished the week at precisely 500. This level acted as magnet to the stock and this is where options could be blamed.


Source: http://www.google.com/finance


Options: backstage


Let us first take some time to quickly review some selected concepts on options:
  • The January option expiry is the busyiest of the year. Contracts for options that come due in the first calendar month are listed two year in advance, unlike other month’s contracts that are available around 9 months beforehand. This means that positions for January have a long time to build up and that makes it a crowded place.
  • As we are nearing their expiration dates, and if we are moving close to their trigger price, options on a specific strike become very sensitive to movements in the underlying.
  • When you enter an order to buy or sell an option, it is probable that a market maker is on the other end of the trade doing the opposite. He is not trying to bet against you, he is just acting as, well, a market maker.
  • The market maker is interested in the margins he gets from trading options; he sells at dearer prices than the ones at which he buys, like any sensible merchant. As he does not want to take a market risk with the positions that result from his business, he will make sure that his option book is properly hedged. One way of doing this is achieved by buying and selling stocks. 


What about Apple?


Let’s look at Apple’s January options Open Interest for Friday; this number gives us the amount of contracts that were traded at different strike levels. That is what Schaeffer's Investment Research did in an article (here): their chart below clearly indicates where people were holding calls and puts contracts for Jan 18th. Specific strikes clearly stand out, like the USD 500 with a total of more than 100k contracts outstanding (calls and puts combined). Let’s think about it: if Apple closes above USD 500, and rounding the calls to 50k, this would mean that 5m shares,or USD 2.5bn worth of Apple, would change hands on this day just with these options. This is just under 1/4 of the 21m shares average daily volume over the past month. Huge.

Source: www.minyanville.com


Do option traders manipulate the prices?


If the closing price is precisely USD 500, options traders that sold options at that strike are at peace. This portion of their book, probably an important one as the chart above indicates, is perfectly safe, as corresponding calls and puts will expire worthless. If it was not the case however, they would need to buy or sell underlying Apple share in order to hedge themselves (this is called delta hedging). The trading activity resulting from the hedging process causes the underlying stock price to be anchored or “pinned” to the busy strike (more detailed info about these dynamics here and here).  Trading on an underlying position that makes up 1/4 of the daily volume can very well influence the market and push you to a specific level, especially if it is not too distant from the current price. This is maybe what we witnessed on Friday. It seems that options traders do not manipulate the market, they rather pollute it and can make it stall somehow.


Takeaways


Option expiries and open interest seem to be important topics, I found plenty of research and trading strategies built around them by preparing this post. Even if I believe that companies’ earnings and other more fundamental aspects have a bigger impact on price in the long term, options markets can be interesting to analyze for shorter term investment time frames. I find it interesting to see that the 580, 550 and 500 levels were all kind of “magnetic” since the beginning of November 2012.They all appear to be busy strikes on the Open Interest chart.

That will be it for today. I hope to come back soon with another post.


I am a financial adviser working for a private bank in Belgium. This is my personal weblog. The opinions expressed here represent my own and not those of my employer. 

    Sunday, January 13, 2013

    Let's get it started

    This item is on my New Year's resolutions list: "Create a blog to dig into some of the investment related topics I come across on a daily basis on and off the job". So let's get it started!

    About this blog


    I am a financial adviser managing portfolios of diversified assets for wealthy people and I spend my days reading about and discussing macroeconomics and financial markets matters. This is more than just a duty, it's also something I like very much. It keeps me connected to the world and the big political, social, technological and cultural trends that make it moving.

    Sometimes, however, I feel overwhelmed by the amount of facts, data and stories that we are thrown at every day, hour, minute, second. Things are going so quickly that I often lose track of items I would like to take some time to take a closer look at, analyse and reflect on.

    But this year it will be different. I will have a blog. It will be the single place where I will log everything I want to remember, the tiny corner of the web where I will drill down the stories I find noteworthy. And if other people find it interesting, they will even able to read along. 

    The fiscal cliff deal: does not solve the long term debt problem in the US


    "The deal cuts $737 billion from deficits over the coming decade, primarily through $618 billion of higher taxes on the rich and the resulting interest savings. But that barely dents the $10 trillion in deficits America was on track to accumulate in that time, roughly 5% of GDP on current policies, according to the Congressional Budget Office." The Economist 

    We did not begin 2013 by falling of the Fiscal Cliff. That was the consensus, but the news still came as a relief. The picturesque metaphor, used by Fed Chairman Ben Bernanke in a February 2012 speech and overused since then, describes the USD 600bn free-fall in GDP that would have automatically caused a recession in the US on the 1st of January without political intervention. This however does not solve the long term debt problem in the US as the aforementioned Economist story details. Full article here.

    Economics 101


    "The economy-as-family metaphor is familiar, emotionally intuitive—and incorrect. It’s a fallacy of composition: What’s true for the part is not necessarily true for the whole. While a single family can get its finances back on track by spending less than it earns, it’s impossible for everyone to do that simultaneously. When the plumber skips a haircut, the barber can’t afford to have his drains cleaned."  Bloomberg Businessweek  

    Short and simple. Full article here.

    Lowered earnings expectation should help


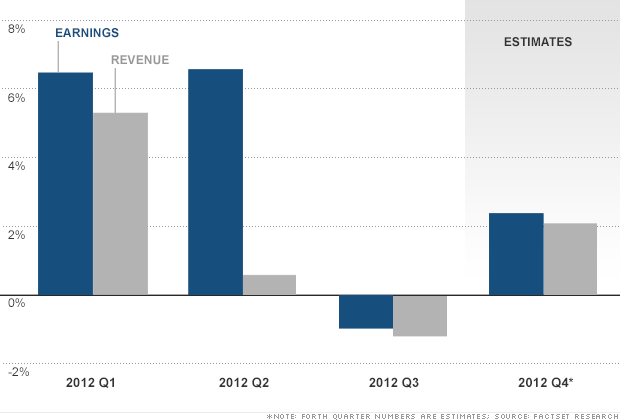
    "Q4 Earnings growth forecast at 2.4% only now vs. 9.2% growth forecast at start of quarter; should be ok to beat consensus." Company Research

    This is comes from an analyst from within my bank. I receive dozens of such one-liners every day at work. Often, these are linked to extensive reports where one can get a bigger picture on the topic and analyse the data used to come to those striking assessments. This time it was not the case so let's do our homework.

    First, the earnings growth we talk about here is the one we get by aggregating the earnings evolution of all companies belonging to the S&P 500, the US stocks market reference. Companies earnings, and the rate at which they grow over time, is one of the factor that influences the most stocks valuation and hence their price. The bigger it is, the more people will be willing to pay to  get a share of those growing revenues through owning stocks.

    What is said here is that expectations investors had about Q4 earnings growth at the start of November was around 4x bigger than what they anticipate now. We are in the Q4 earnings release period just right now. Lowered expectations means that people will not fall of their chair if the figure doesn't come in the high single digit area. It is good for markets when investors do not all fall of their chair at the same time.

    I have found an article giving more info about this on CNN Money here together with a graph that shows actual past quarters revenue and earnings growth rates and current estimates for Q4. The difference between Q2 2012 earnings and revenue growth figures is striking (to be checked). 


    According to CNN, the lowered expectations have much to do with the numerous companies that issued gloomier outlook in their guidance during the quarter, especially in the tech sector.

    I am a financial adviser working for a private bank in Belgium. This is my personal weblog. The opinions expressed here represent my own and not those of my employer.